
Fear and greed are emotions that affect every investor in the stock market. Having these two emotions under control when investing and trading on the stock exchange is both the most difficult and the most important thing. Only those who do not let themselves be guided by them can be successful on the stock exchange in the long term.
The market constantly fluctuates from one extreme to the other. On the stock market, this results in share prices exaggerating upwards or downwards. When the market is in a very good mood, prices seem to rise forever. Who is longer at the stock exchange knows that does not rise eternally! Especially not a share!
The bigger and faster the price increase happens, the more violent the correction will be. So you can see from the "Fear and Greed Index" at the end of a stock market rally that the index is close to a value of 100. This means that there is great greed in the market. This is often a warning sign that a correction is coming soon.
Very large corrections are often referred to as a "crash". Sudden, rapid and violent falls in share prices cause fear. Especially inexperienced investors and traders often sell exactly at the point of greatest fear. Therefore, in order to trade successfully, it is important to trade the market countercyclically to its sentiment. The "Fear and Greed Index" is a visual help to recognize in which situation the market is.
What is the "Fear and Greed Index"?
The "Fear and Greed Index" was created by CNN as an indicator of market sentiment. It indicates the prevailing market sentiment and varies from 0 to 100. A value of 50 indicates a neutral market sentiment. All values less than 50, indicate fear in the market, while a value close to 0 means extreme fear. Values from 51 to 100 means good market sentiment, with the value towards 100 indicating extreme greed.
It is calculated using 7 different factors and updated several times a day on CNN's website.
By loading the video, you accept YouTube's privacy policy.
Learn more
How is the "Fear and Greed Index" calculated?
The Fear and Greed Index is calculated by CNN using 7 different factors. All these factors are used to determine the market sentiment and to express it in a concrete value. Each individual factor by itself is already an indicator of market sentiment. However, taking all 7 factors together gives a clearer and more reliable picture of the overall market. This improves the informative value of the "Fear and Greed Index".
CNN looks at how far they are from their average for calculating each factor. Depending on this, this is translated into a scale of 0 to 100, with 50 corresponding to a neutral factor. All 7 factors are calculated according to this principle and then equally weighted together in the "Fear and Greed Index".
Factor 1: Junk bond demand
"Junk bonds" are bonds that have a high risk of default. This means that the capital lent with the bond cannot be repaid. In line with the high risk, junk bonds generally have a higher yield on their bonds. The demand for junk bonds relative to the demand for well-rated bonds is included as a factor in the CNN Fear and Greed Index. If investors become riskier, they will invest more in junk bonds. Yields on junk bonds fall accordingly, while yields on positively rated bonds rise. The spread of these two yields thus provides information on investors' risk appetite.
Factor 2: Market momentum
Market momentum is measured by the distance of S&P 500 stock prices from their 125-day average. The further stock prices are from this average, the greedier the market is. The closer it is to the line or even below it, the more fearful the market is.
Factor 3: Share price range
The information on stock price depth comes from the "McClellan Volume Summation Index". This calculates the sum of the trading volume of rising stocks versus the trading volume of falling stocks. Towards the end of an uptrend, trading volume often decreases. This is also called bearish divergence and is a sign of declining buying interest. Accordingly, a falling stock price range is a sign of a trend reversal and too much greed in the market.
Factor 4: Share price strength
Stock price strength is the ratio of stocks on the New York Stock Exchange that make a 52-week high to those that make a 52-week low. During periods of euphoria in the market, you can often tell that just about all stocks are going up. No matter how highly valued they are or how well their businesses are doing. Stock price strength is therefore a good indicator of euphoria in the market, the last phase of a market cycle.
Factor 5: Safe harbors demand
Safe haven demand" does not mean the demand for gold. Rather, it is the ratio of the performance of equities versus the yield of government bonds. If the return on equities falls below the return on government bonds, this indicates extreme fear in the market.
Factor 6: Market volatility
Market volatility is determined using the "CBOE Volatility Index" (VIX). Market volatility is primarily an indicator of investors' short-term fear of price losses. Accordingly, market volatility rises quickly and sharply in the event of unexpectedly bad news. Of particular interest is the value of the VIX relative to its 50-day average. The higher it is above the 50-day average, the more extreme the fear in the market. If it is far below the average, greed is at play.
The "Volatility Index" can also be traded as a CFD, but only a few CFD brokers offer it. The VIX is tradable among others at Plus500*.
Risk note Plus500: 82% of CFD retail investor accounts lose money.
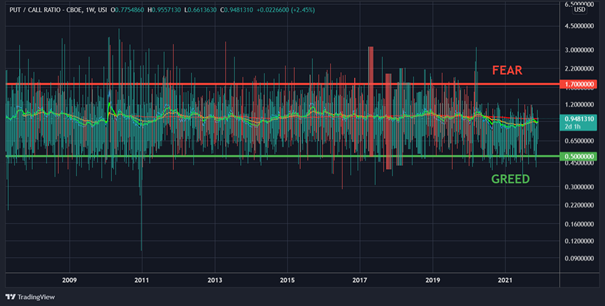
Factor 7: Put-call ratio
The put-call ratio is a direct indicator of how investors assess the risk on the market. If the put-call ratio rises, there is an increased demand for puts on the market. Since puts bring a profit when prices fall, they are also used as a hedge or hedge against falling prices. Calls, on the other hand, are used to speculate on rising prices and profit from them.
Put-call ratio greater than 1 = fear in the market (extreme zone from approx. 1.7 historically)
Put-call ratio less than 1 = greed in the market (extreme zone from approx. 0.5 historically)
How should I understand the "Fear and Greed Index"?
The "Fear and Greed Index" is not an exact indicator of when to buy or sell stocks. In this respect, the "Fear and Greed Index" should not be misunderstood. Rather, as a trader and investor, one should become alert when the indicator fluctuates in one direction or another and approaches the extreme values.
The higher the value of the "Fear and Greed Index", the more cautious investors should become. A setback may be imminent. However, a correction in the stock market always requires a certain trigger. A piece of bad news that causes the market to topple. The longer the "Fear and Greed Index" is near 100, the sooner investors should prepare to experience a correction.
The "Fear and Greed Index" using the example of the 2009 financial crisis:
A good example to understand the "Fear and Greed Index" is the financial crisis 2008/2009. September 17, 2008 was the peak of the financial crisis. At that time, no one could say for sure. But the "Fear and Greed Index" had already indicated extreme fear and showed a value of 12. As you can see from the chart, the price of the S&P 500 continued to fall significantly in the coming weeks and months. The "Fear and Greed Index", however, was able to gain ground and its value increased during this time. At the end of the financial crisis and the bear market on March 09, 2009, the value of the "Fear and Greed Index" was able to rise to 28.
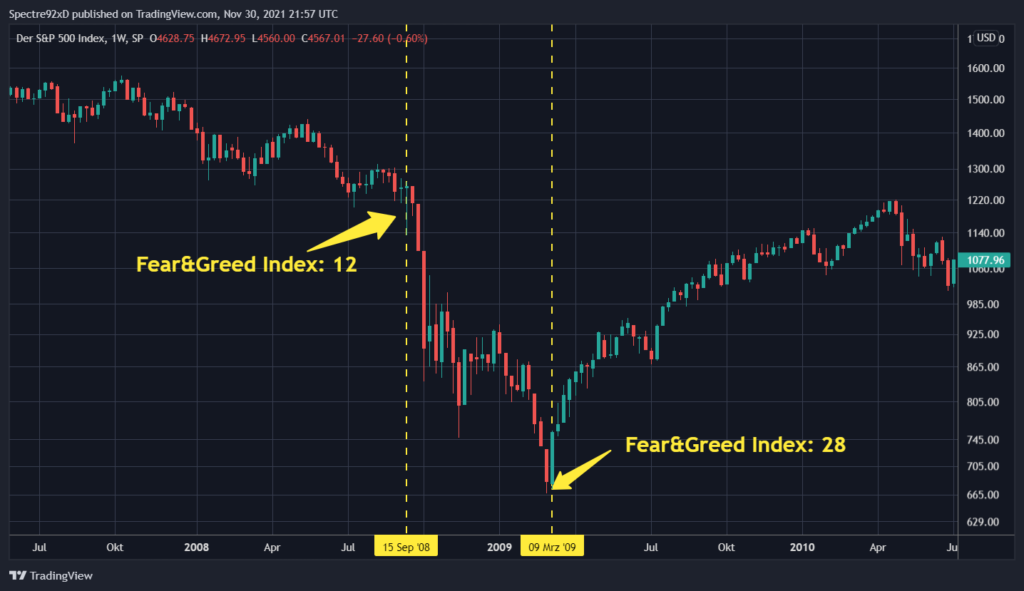
As can be seen clearly from this example, extreme fear alone is not meaningful enough for the "Fear and Greed Index". The value can stay in fear regions and values smaller than 50 for long periods of time. It is important to look at the big picture. So also pay attention to other indicators, the news situation and the chart technique.
How do I align my trading with the "Fear and Greed Index"?
The "Fear and Greed Index" is one of many indicators that should be used for personal market analysis. As already mentioned, it is not very meaningful on its own. Therefore, it should be considered together with other components and indicators.
For example, if you are looking to enter the market during a stock market setback, you can do the following:
- Wait until the "Fear and Greed Index" indicates extreme fear (values of about 20)
- Watch for improvements in messaging
- Wait for oversold zone in RSI and watch for bullish divergences.
Can I predict a crash with the "Fear and Greed Index"?
No one can predict a crash at 100%. Not even with the "Fear and Greed Index"! A crash always requires a trigger. This trigger is usually an external factor or news that the market has not yet priced in and has serious implications for the world economy or the global financial system. However, the "Fear and Greed Index" helps to adjust risk management and to reallocate in phases of long-lasting extreme greed and to build up cash reserves if necessary.
In general, one should always keep in mind that the "Fear and Greed Index" is a lagging indicator. Making concrete statements for the future is therefore only possible to a limited extent. However, it is very well suited as a visualization of market sentiment!
Plus500 risk note: CFD are complex instruments and come with the high risk of losing money quickly because of the leverage effect. 82% of retail investor accounts lose money trading CFDs with this provider. You should consider whether you understand how CFD work and whether you can afford to take the high risk of losing your money.